Service duration is simply how long one customer occupies your service, from the moment they sit down, get seen, or place an order to the moment they leave, and it's the single number that makes every wait estimate honest. Ezseat and peer-reviewed research on delay announcements agree on the fix: measure real start and end times, calculate a rolling average by service category, add a conservative buffer, and update it often. Skip the measurement step and every wait time you post is a guess dressed up as data.
TL;DR:
- Improving the accuracy of service duration data can significantly reduce wait time oscillations and increase customer trust.
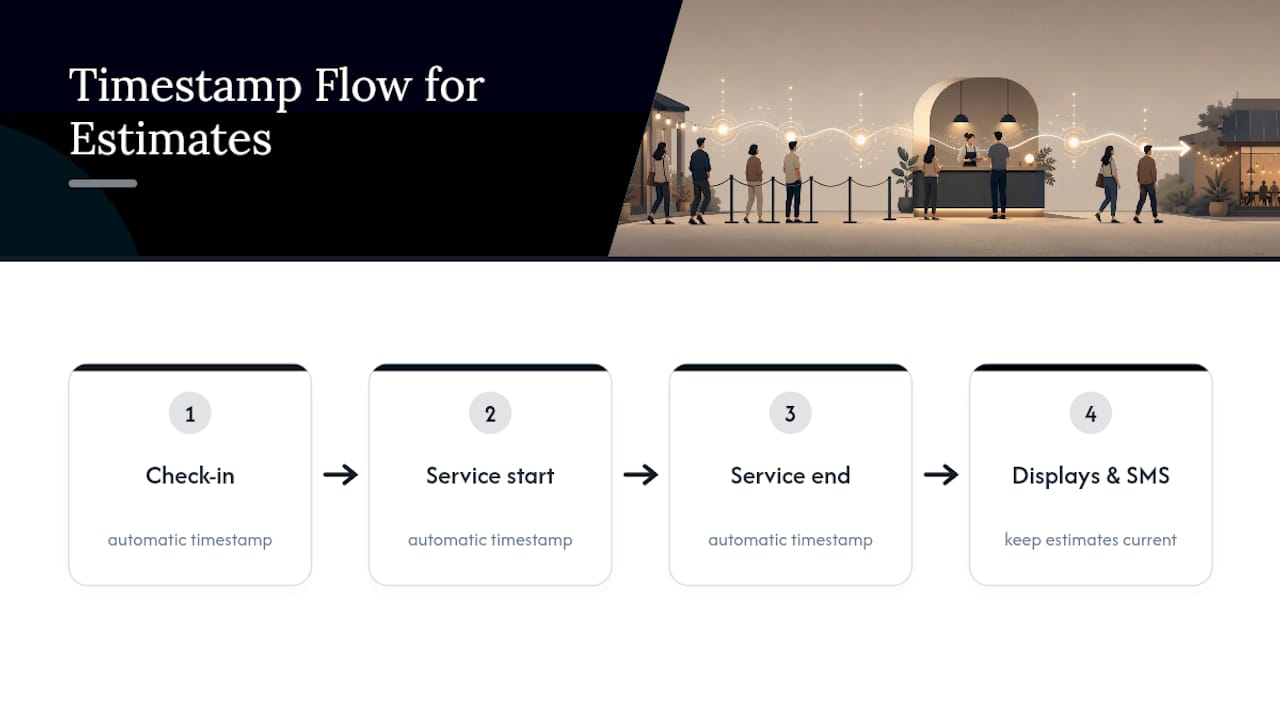
- Collecting comprehensive timestamps for check-in, service start, and service end as well as categorizing services enhances forecast precision with minimal effort.
- Small venues benefit from updating averages weekly or seasonally, while larger businesses can consider machine learning models once they gather sufficient clean data.
- Better service duration estimates enable real-time adjustments in staffing, queue management, and priority lanes, improving overall efficiency.
- Ezseat automates timestamp collection through browser-based check-in, offering a low-cost setup with a free trial to refine wait estimates and monitor abandonment.
Table of Contents
- Why Accurate Service Durations Change the Customer Experience
- How to Measure Service Duration Without Guessing
- Estimating and Predicting Service Duration: Three Tiers That Actually Work
- What Better Duration Data Actually Changes on the Floor
- Setting Up Service-Duration Settings in Your Queue System
- Ezseat's Approach to Duration Data in Practice
- An Operator's First-Week Checklist
- Try It Without the App Download Friction
- Sources
- FAQ
Why Accurate Service Durations Change the Customer Experience
Bad duration data doesn't just make your wait estimate wrong. It makes the whole line behave badly. Underestimate how long a haircut, a consult, or a burrito bowl takes, and every promised time slips, customers start showing up late or leaving early, and your staff spends the afternoon apologizing instead of working. Overestimate, and you sit on idle capacity, staff who could take walk-ins but don't, and empty chairs that could have generated revenue.
The fix isn't complicated, but it does require discipline. Research on delay announcements found that sharing expected wait times improves customer satisfaction and shapes how people decide whether to join a queue at all. The catch: stale estimates cause customers to bunch up or bail out in waves, an effect researchers call oscillation. An estimate posted once at 9 a.m. and never touched again is worse than no estimate.
Four metrics move when your duration data gets better:
- Perceived wait time, which often matters more to satisfaction than the actual clock time.
- Abandonment rate, or how many people leave before being served.
- Throughput, the number of customers you can realistically serve per hour.
- Staff utilization, meaning how much of a shift is spent working versus standing around.
Reality check: a queue that quotes 10 minutes and delivers 25 loses trust faster than one that quotes 20 minutes and delivers 18.
How to Measure Service Duration Without Guessing
You can't average what you never recorded. The starting point is a small set of timestamps, captured consistently, for every customer who moves through your queue.
At minimum, log:
- Check-in time — when the customer joins the queue, whether that's a phone check-in, a kiosk tap, or a walk-up.
- Service start time — when a staff member actually begins working with them.
- Service end time — when the customer is done and the seat, chair, or table is free again.
- Service category — haircut versus color, dine-in versus takeout, new patient versus follow-up.
- Staff ID — because duration varies by who's doing the work, sometimes by a wide margin.
Your data sources are probably already collecting pieces of this. Point-of-sale systems timestamp orders, reservation platforms log appointment windows, tablet or phone check-ins capture arrival, and kiosk scans mark entry. Mobile staff, like food-truck crews or delivery-adjacent service roles, can add GPS-based timestamps for even tighter accuracy, a method machine-learning research on delivery service times has used effectively.
Cleaning the data matters as much as collecting it. Drop or flag records with missing end-times rather than guessing. Remove obvious outliers, like a 90-minute haircut that was really a staff break someone forgot to log. And trust system timestamps over manual self-reports every time. A barber writing "20 min" from memory at the end of a shift is not the same data quality as a tablet that logged the actual start and stop.
Pro Tip: A café can capture this with almost no extra work: the POS timestamps the order, a simple "order ready" button timestamps completion, and the gap between the two is your service duration, automatically, for every single transaction.
Estimating and Predicting Service Duration: Three Tiers That Actually Work
Most venues don't need a data science team to get useful wait estimates. They need a method that matches their size, and there are three realistic tiers.
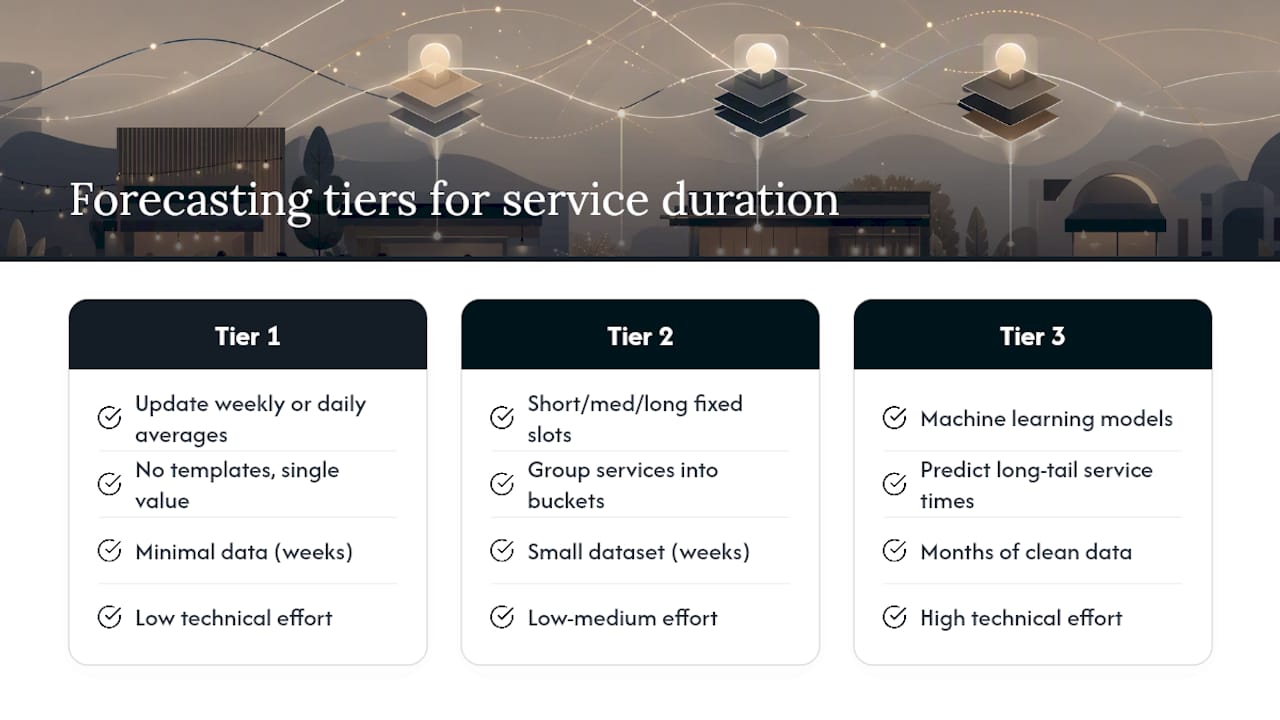
Update the average weekly, or daily during busy seasons. This single step, according to a practitioner guide on reducing client wait time, delivers most of the benefit small venues will ever need from duration forecasting, with almost no technical overhead.
Tier two: structured templates. Group services into short, medium, and long buckets, assign each a fixed slot, and let your schedule or queue system route customers accordingly. A quick consult, a standard visit, and a deep-cleaning appointment don't belong in the same average.
Tier three: machine learning. Once you have months of clean, labeled data, models like artificial neural networks can outperform simple averages, particularly for predicting the longer, less common service times that averages tend to underestimate. That accuracy comes at a cost: ML approaches for service-time prediction need large, well-cleaned datasets and features like staff experience or item type to be worth the effort. Most single-location restaurants, clinics, and barbershops won't hit that data threshold for a year or more.
Whichever tier you pick, verify it. Run two weeks of predicted-versus-actual comparisons, note where the gap is widest, and adjust the buffer or category split accordingly.
What Better Duration Data Actually Changes on the Floor
Once you trust your numbers, they stop being a reporting exercise and start driving decisions in real time.
- Live displays and notifications built on accurate durations cut perceived wait time because customers see a number that actually moves toward zero, instead of one that stalls or jumps.
- Staffing and shift overlap get easier to plan when you know that Tuesday lunch runs 12 minutes per table and Friday dinner runs 22, so you schedule bodies where the time actually goes.
- Express and priority lanes become possible once you can separate a five-minute quick service from a 40-minute full treatment and route each into its own flow instead of one undifferentiated line.
- Abandonment drops when the estimate a customer sees at check-in resembles the wait they actually experience, which is the core finding behind delay-announcement research: frequent, honest updates change joining behavior for the better.
Virtual and browser-based check-in adds a second benefit here: it lets people wait wherever they want instead of standing in your lobby, which pickup waitlist etiquette highlights as key for better wait experiences and smoother organizer-player communication, sharply lowering perceived wait and improving staff productivity since nobody's hovering at the counter watching the clock.
Setting Up Service-Duration Settings in Your Queue System
Turning this into a working system is a short project, not a quarter-long rollout.
- Define your service categories and give each a default duration based on your rolling average, not a guess.
- Turn on automatic timestamps for check-in, service start, and service end so you stop relying on staff memory.
- Set buffers and peak-hour modifiers — a 20% buffer on a normal Tuesday might need to be 35% during a Saturday rush.
- Automate the rolling-average recalculation so estimates update on their own, and put a weekly audit on the calendar to catch drift.
- Decide your announcement cadence — how often the system pushes an updated wait estimate to customers already in line, since a number that never refreshes defeats the purpose.
Pro Tip: Start your buffer high. It's far less damaging to tell a customer 25 minutes and serve them in 18 than to promise 15 and make them wait 25. You can tighten the buffer once your rolling averages prove stable over a few weeks.
Guides like Ezseat's walkthrough on web-based waitlist setup and its queue display screen guide both walk through this exact sequence for restaurants and clinics specifically.
Ezseat's Approach to Duration Data in Practice
Ezseat runs on browser-based check-in, so there's no app for customers to download before they can join a queue or get a notification. Every check-in, service start, and service end can be timestamped automatically, feeding the live displays and SMS alerts that keep wait estimates current instead of static. Operators wanting more detail on the estimation side can review Ezseat's guide to wait-time estimation, which covers the same rolling-average and buffer logic in more technical depth, alongside setup notes for small restaurants and food trucks specifically.
An Operator's First-Week Checklist
Here's the short version, from the floor rather than the whiteboard: turn on timestamps, define your service categories, and start collecting data immediately, even before you trust it. By day five or six, compute rolling averages and publish a conservative wait estimate. Watch abandonment closely that first week, adjust your buffer if people are walking off, and put a recurring weekly audit on the calendar before you forget to.
— Ezseat
Try It Without the App Download Friction
An advantage of browser-based queue setups is that customers can join, wait, and get notified entirely through a web browser, with no app installation required, reducing barriers for first-time visitors. That matters most in the exact moments this guide covers, when you're trying to publish an honest wait estimate and someone's phone storage or Wi-Fi becomes the reason they walk away instead.
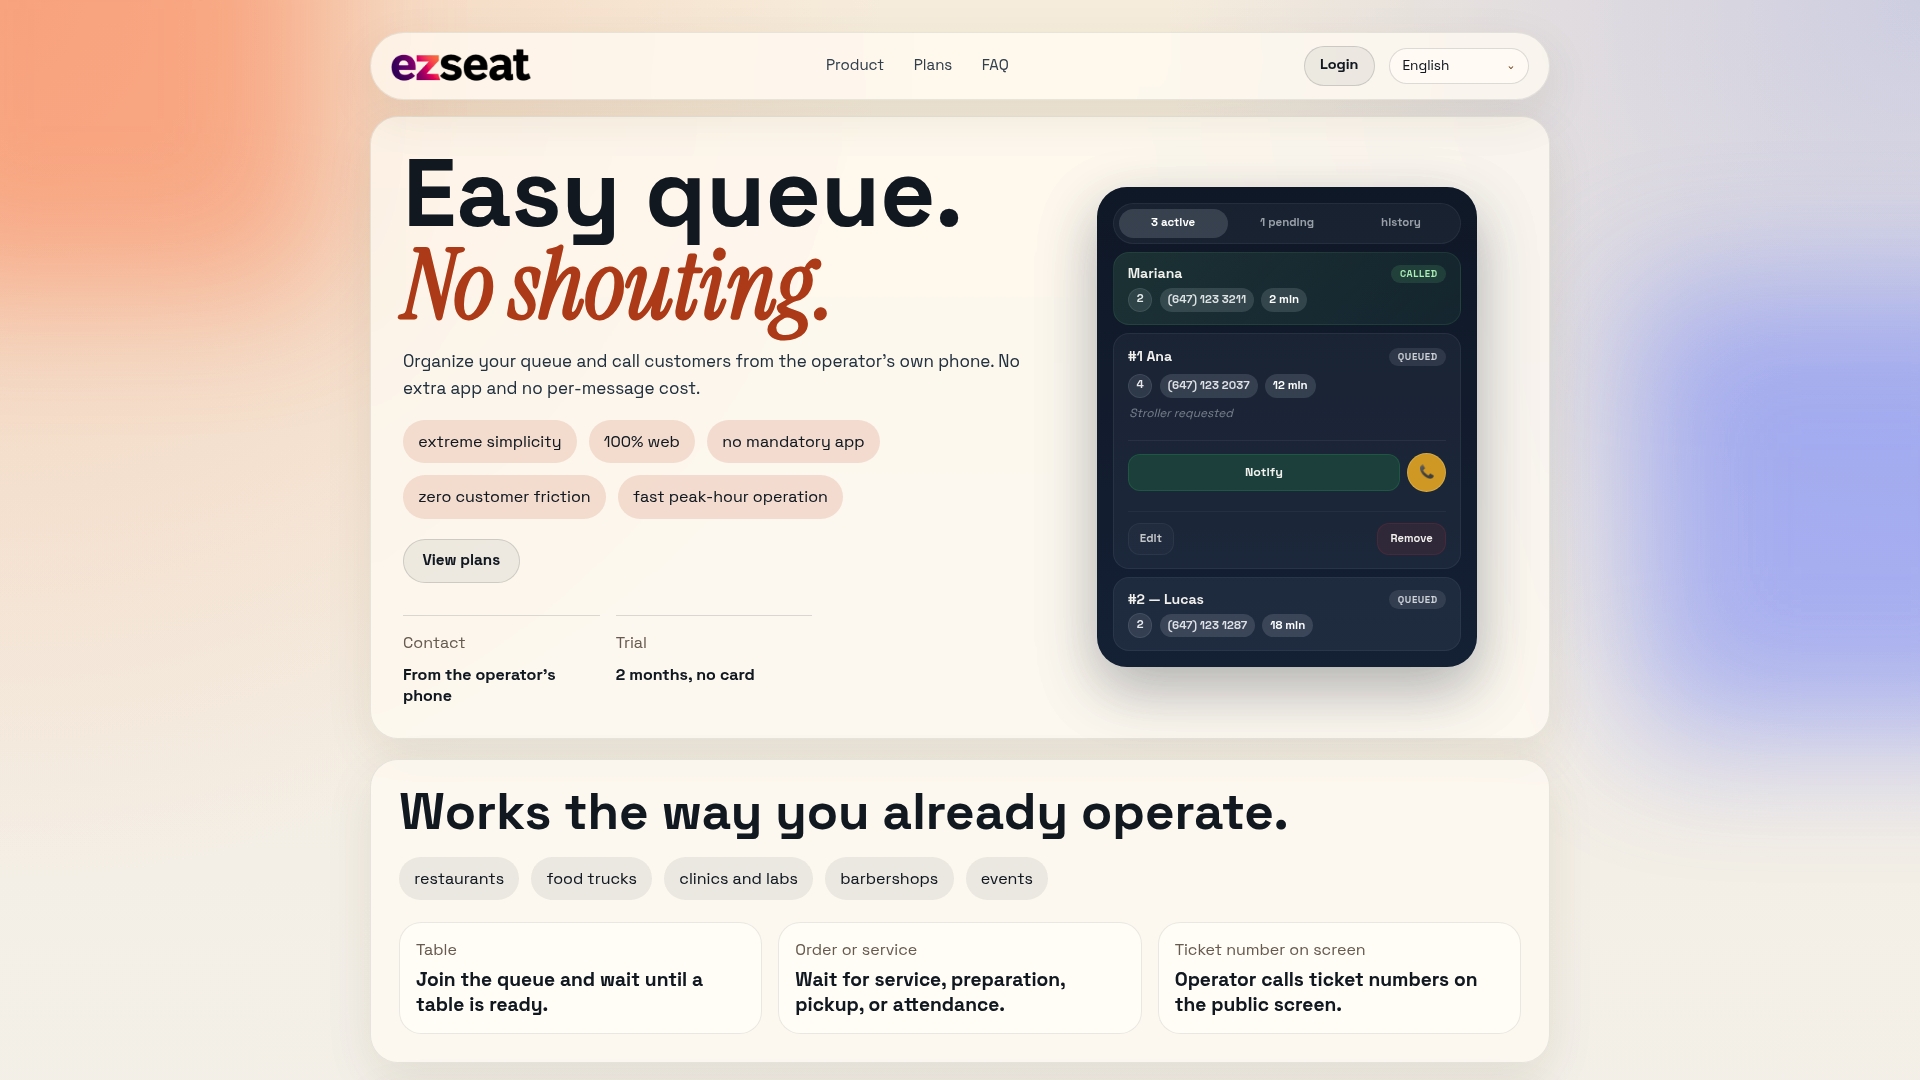
The Light plan starts at $3.90 per month ($39.00 billed annually), and the Pro plan runs $14.90 per month ($149.00 annually) for venues that need multi-queue and multi-device setups, custom fields, or heavier notification volume. Ezseat offers a free two-month trial before either tier is billed, so you can measure your real service durations, publish a rolling-average estimate, and see the abandonment numbers move before committing a dollar. Start the trial and get your first timestamps logging today.
Sources
For deeper technical grounding, see the research on wait-time predictors under variable staffing, the ML study on delivery service-time prediction, and Ezseat's own queue analytics metrics guide.
- Delay announcements and their operational impact
- How to reduce waiting time for clients in service businesses
FAQ
What Is Service Duration in a Customer Queue?
Service duration is the time a single customer spends being actively served, measured from service start to service end. It excludes the time spent waiting in line before their turn, which is tracked separately as wait time.
How Do I Calculate Average Service Duration?
Log the start and end timestamps for each customer in a service category, then average recent records to get a workable rolling average. A practitioner guide on reducing client wait time recommends updating that average regularly rather than treating it as fixed.
Why Do Wait-Time Estimates Need to Update So Often?
Stale estimates cause customers to bunch up or leave in waves, since people react to the number they're shown, not the real state of the line. Research on delay announcements found that frequent updates reduce this oscillation and improve satisfaction.
Do I Need Machine Learning to Predict Service Duration?
No. Most restaurants, clinics, and barbershops get most of the benefit from a simple rolling average plus a buffer. Machine learning models can improve accuracy for longer, less predictable service times, but they require large, cleaned datasets most single-location businesses won't have for a year or more.
How Does Ezseat Use Service-Duration Data?
Ezseat timestamps check-in, service start, and service end automatically through browser-based entry, no app required, and uses that data to power live wait displays and SMS notifications. Pricing starts at $3.90 per month on the Light plan, with a free two-month trial before billing begins.